Introduction
The Table and Matrix visualizations in Power BI appear similar, both presenting data in a tabular format reminiscent of Microsoft Excel. However, it’s crucial to understand the distinctions between these two visualization types for efficient data display.
Difference Between matrix and table in Power BI
The fundamental difference lies in the dimensions of data display. Tables in Power BI are limited to presenting data in two dimensions. Users can input data fields as values and showcase them as columns. On the other hand, Matrix visualizations offer more flexibility in presenting data as a table. Users can specify both rows and columns, and leverage additional layers to exploit Power BI’s drill-down functionality.
How powerful matrix are compared to power bi tables ?
Matrix allows users to define not only rows and columns but also to layer the data. This layering capability enables a more dynamic and detailed representation of information. The user can take advantage of Power BI’s drill-down functionality, which means they can delve deeper into the data hierarchy for a more granular analysis.
These are the options you have in table and matrix-
Column Options:
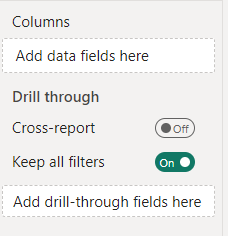
Matrix options:
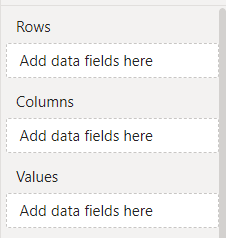
See how different the options are for both of these “visualizations”.
Thanks For Reading!
READ MORE:
Power BI Treemap
Power BI Matrix In-depth